Visualizing Mass Communications and State Institutions in Wartime China (1937-45)
In China, the study of history has always gone hand-in-hand with the study of geography. When studying China’s modern history, however, focus has shifted toward large-scale processes, such as revolution, and large-scale sociological transformations, such as changing class relations. More recently, however, some historians are starting to bring geography back in. Pathbreaking endeavors such as the China Historical GIS project and Harvard University WorldMap platform-based ChinaMap allow researchers to visualize the transformation of China across space and time. The result has been a new understanding of China and Chinese history highlighting the spatial distribution of ethnic and linguistic diversity, economic development, elite networks, and state institutions. One exciting result of this new understanding is that it allows students and researchers alike to visualize large-scale processes across time periods, which can in turn lead to new questions about how different places might have experienced the same era or event. Through the use of spatial approaches, we are challenged to rethink the applicability of national historical narratives to local human landscapes.
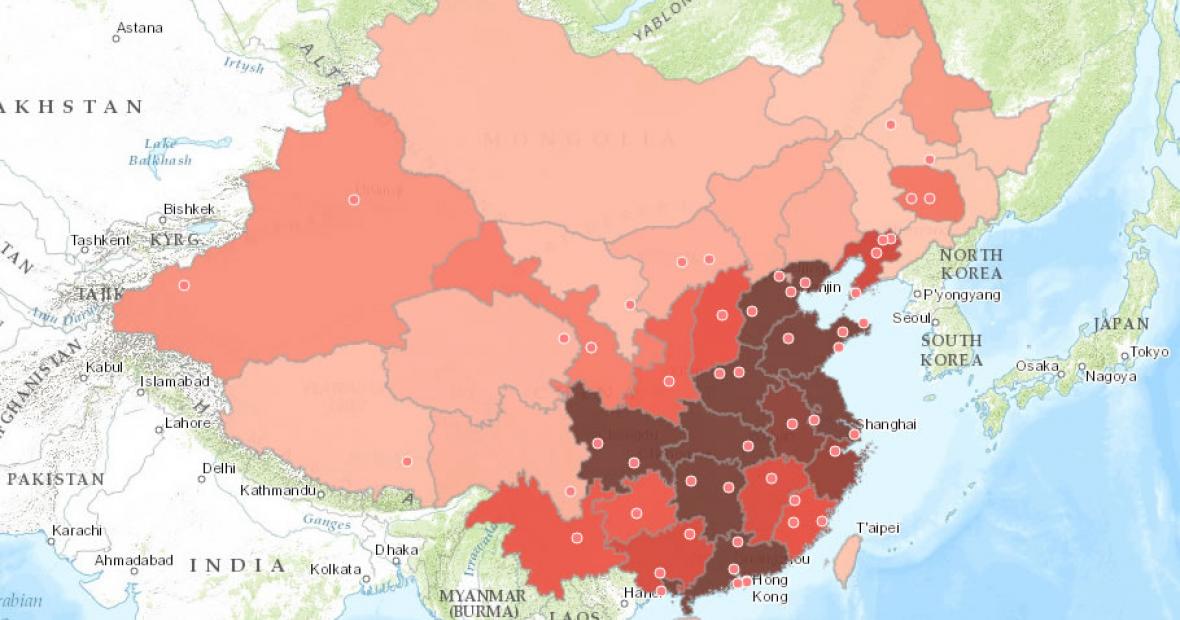
As a teacher and researcher of East Asian history, much of what I do focuses on how media, institutions, and person-to-person networks have connected the modern Chinese state to populations both inside and outside of China. Working in tandem with DASIL, I have begun to build and visualize datasets which describe how the “connective tissue” of state-building looked during the period of China’s War of Resistance to Japan (1937-1945)—a period of intense destruction and dislocation which some historians have also described as key period of modernization. This data is drawn from two editions of The China Handbook: a publication of the Chinese Ministry of Information released in 1943 and again in 1946. I discovered this publication quite by happenstance while searching the Grinnell College Library collections for local gazetteer data related to the period of China’s Republican Era (1911-1949). The value of The China Handbook is that it provides comprehensive provincial and urban data for a number of indicators of state development; here we (myself and DASIL’s outstanding post-bac fellow, Bonnie Brooks ’15) have focused on data concerning communications, education, and health care. To be fair, and as admitted by The China Handbook’s original editor, Hollington K. Tong, this data is not exhaustive, nor is it necessarily reliable given the rapidity of changes brought about by war and resulting partition of China into competing political zones. It does, however, represent at least a starting point for visualizing what China’s wartime states looked like “on the ground,” viewed through the lens of communications and other institutional infrastructure.
Below the level of national boundaries, modern China is divided into numerous separate administrative units known as provinces. However, the number of provinces has changed with time and successive governments, which poses a challenge for those seeking to visualize data at the province level for eras during which the number of these units was larger than it is today — as was the case during the latter half of the Republican Era, which witnessed a proliferation of efforts to tame China’s restive and geopolitically fragile borders through the process of province-building. A key part of Bonnie’s contribution, then — the results of which will hopefully be used and refined by other researchers working at the intersection of geographic information systems (GIS) and modern Chinese history — was the creation of new shapefiles corresponding to each province that existed during the 1937-1945 period. The resulting maps are thus entirely new creations, and will hopefully serve to help bridge the current gap which lies between geospatial research on imperial China and research on contemporary China after Mao. The shapefiles are available for download in DASIL’s Downloadable Data section.
For the map:
- The Contents button() will display all layers. Unclick the checkbox next to the layer name to hide the layer. To view the legend, click on the “Show Legend” icon () below the layer name.
- To examine other variables, find the “Change Style” button () below the layer name you wish to view, then select the desired variable from the “Choose an attribute to show” drop-down menu. You may alter the map with colors, symbols or size. You may also alter variables (e.g. normalize variables by population).
- Click on an individual Chinese province to see available data.
- The shapefiles featured in the map are available for download on the DASIL website.